
Action. Integrity. Results.
From Diagnostics to Launch in 4 stages
STAGE 1
Assess your business requirements and complete diagnostics review
STAGE 2
Build business case to approve process recommendations and gain management alignment
STAGE 3
Implement aligned process improvements, review and refine as required
STAGE 4
Launch of process, success tracking enabled, focus on continual improvement
What is the S&OP process and what are the benefits?
Portfolio
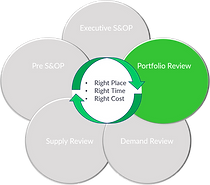
Improve visibility on all product portfolio introductions (New Product Development), changes and exit strategies. Discover your optimal portfolio (SKU Rationalisation) and gain control over the product life cycle.
pORTFOLIO
Demand

Capture and consensus meeting of forecasts and assumptions for the relevant horizon.
Improve customer service results and forecast accuracy using one source of truth.
DEMAND
Supply

Improve the balance of supply and demand. Review capability, capacity and costs to meet future demand.
Improve customer & internal service targets, optimise inventory & operating costs.
SUPPLY
Pre S&OP

Designed to review & action any escalated outputs from previous cycle meetings.
Review of key business projects and metrics - i.e. Dashboard
KPI reporting.
Full cross functional alignment.
PRE S&OP
Exec S&OP

Senior leadership meeting to review S&OP cycle performance presented at an aggregate level.
Designed to enable better visibility, communication and uncomplicated decision making for the management team.